
Starting to dig
Starting to dig
Motivating observations, descriptions of data formats

In theory, NOAA are selfless scientists and public servants in relentless pursuit of the truth for the benefit of all. But I’ve become a tad cynical in my old age, so let’s fire up our command shells and code editors and use them to pry up the floorboards, peer into the darkness, and see if any skulls are looking back at us from the dirt. In other words, let’s look for mistakes in NOAA’s work and then tell everyone what we find, without mercy. You know, science.
Clicking around in the maze of NOAA pages, I eventually ended up on the Climate at a Glance | National | Time Series page. Let’s ask it to generate a chart using these settings:
Parameter: Average Temperature
Time Scale: 60-Month
Month: January
Start Year: 1900
End Year: 2022
Options:
Display Base Period: uncheck
Display Trend: check
Hit Plot. We get something like this:
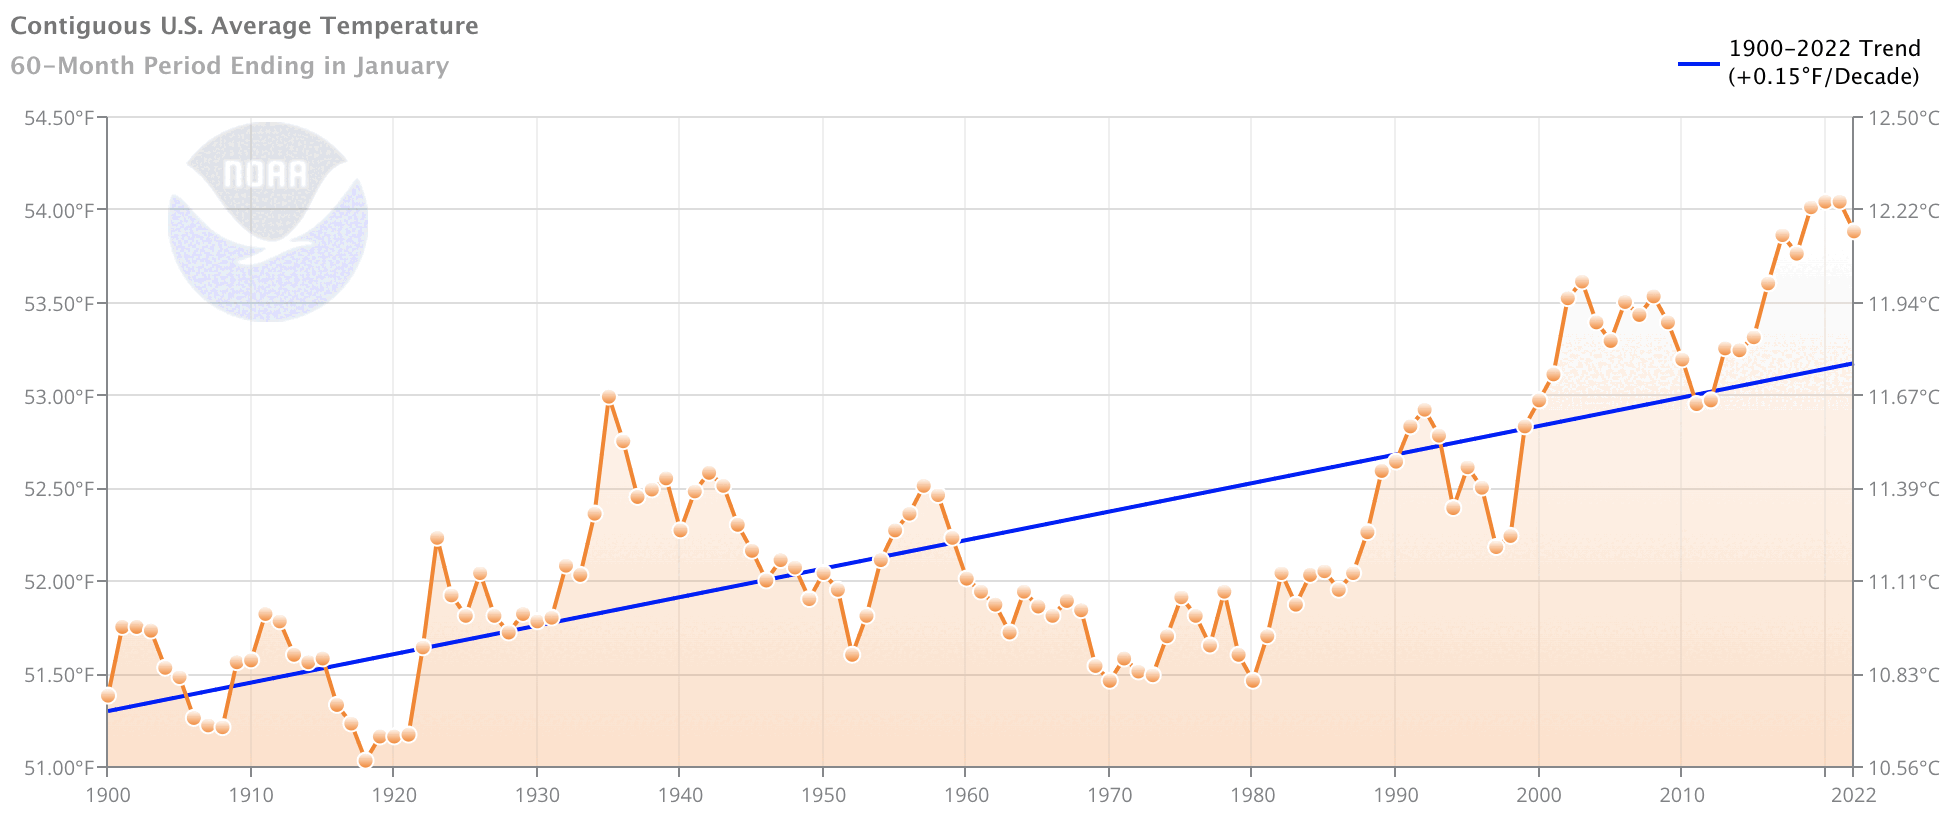
OK, looks very scientific. Eying the trend line, it looks as if it goes from 51.5F in about 1915 to 52.5F in about 1978. That’s one degree F over about six decades, so the claim of 0.15F/decade seems reasonable (mathematically).
But something looks funny—the chart says that 1992 and 2000 were as hot as it was during the 1930s. That’s not the story I’d heard, which was that the 1930s in the US were extremely hot with long periods of every state having readings over 100F and many over 110F—conditions which would probably be declared a national emergency if they were to happen today.
But maybe I heard wrong. Let’s get NOAA’s data and write some programs to analyze it. The first NOAA data URL to be aware of is the one for the so-called “final” data. I get the impression that this data has been through a tortuous process of massaging, but I don’t know the details.
Something like this should work to retrieve the data:
mkdir data
cd data
wget 'https://www1.ncdc.noaa.gov/pub/data/ushcn/v2.5/ushcn.tavg.latest.raw.tar.gz'
wget 'https://www1.ncdc.noaa.gov/pub/data/ushcn/v2.5/ushcn.tavg.latest.FLs.52j.tar.gz'
tar zxvf 'ushcn.tavg.latest.FLs.52j.tar.gz'
tar zxvf 'ushcn.tavg.latest.raw.tar.gz'
After that, data will contain a directory like ushcn.v2.5.5.20220824 with a bunch of files of the form USH00223975.raw.tavg or USH00223975.FLs.52j.tavg. These files end with tavg because they pertain to an average temperature calculation called TAVG. USH00223975 is the name of a particular measuring station. Finally, raw and FLs.52j are the names of datasets.
What’s in these files? The format is documented pretty well in the readme. I can’t complain much here—all the records in these files are the same length, and the data is in fixed-length columns.

The first 11 bytes of each line are the station ID (same as in the name of the file, and this will not change within the file). Then there’s a year. Then there are 12 chunks, one for each month of that year. Each chunk is 9 bytes and contains an integer number of hundredths of degrees C, followed by 3 bytes of flags.
It’s not pretty, but it’s like a programming homework assignment to parse it once you know what you’re looking at.
Let’s write some code to compute the 60-month smoothed average temperature of the contiguous US using data from the FLs.52j dataset:
| FINAL_DIR = "data/ushcn.v2.5.5.20220824" | |
| ELEMENT = "tavg" | |
| DATASET = "FLs.52j" | |
| FINAL_LINE_LENGTH = 124 | |
| NUM_MONTHS_IN_YEAR = 12 | |
| def get_final_filenames | |
| Dir.glob("#{FINAL_DIR}/*.#{DATASET}.#{ELEMENT}") | |
| end | |
| def chunkify_string(s, size) | |
| (0 .. (s.length - 1) / size).map { |i| s[i * size,size] } | |
| end | |
| class FinalRecord | |
| attr_reader :year, :values, :dmflags, :qcflags, :dsflags | |
| def initialize(attrs) | |
| @year = attrs.fetch(:year) | |
| @values = attrs.fetch(:values) | |
| @dmflags = attrs.fetch(:dmflags) | |
| @qcflags = attrs.fetch(:qcflags) | |
| @dsflags = attrs.fetch(:dsflags) | |
| end | |
| def to_s | |
| dmf = @dmflags.map{|e| e.nil? ? "." : e}.join() | |
| qcf = @qcflags.map{|e| e.nil? ? "." : e}.join() | |
| dsf = @dsflags.map{|e| e.nil? ? "." : e}.join() | |
| "f #{@year} #{@values.join(",")} #{dmf} #{qcf} #{dsf}" | |
| end | |
| end | |
| class Final | |
| def self.from_file(filename) | |
| data = File.read(filename) | |
| Final.from_data(data) | |
| end | |
| def self.from_data(data) | |
| id = nil | |
| records = [] | |
| lines = data.split("\n") | |
| lines.each do |line| | |
| if line.length != FINAL_LINE_LENGTH | |
| raise "line length #{line.length} != #{FINAL_LINE_LENGTH}" | |
| end | |
| x = line[0,11] | |
| if id.nil? | |
| id = x | |
| else | |
| raise "id #{x} != id #{id}" if x != id | |
| end | |
| year = line[12,4].to_i | |
| values = Array.new(NUM_MONTHS_IN_YEAR) | |
| dmflags = Array.new(NUM_MONTHS_IN_YEAR) | |
| qcflags = Array.new(NUM_MONTHS_IN_YEAR) | |
| dsflags = Array.new(NUM_MONTHS_IN_YEAR) | |
| chunks = chunkify_string(line[16..], 9) | |
| chunks.each_with_index do |chunk, idx| | |
| value = chunk[0,6].to_i | |
| dmflag = chunk[6] | |
| qcflag = chunk[7] | |
| dsflag = chunk[8] | |
| value = nil if value == -9999 | |
| dmflag = nil if dmflag == " " | |
| qcflag = nil if qcflag == " " | |
| dsflag = nil if dsflag == " " | |
| values[idx] = value | |
| dmflags[idx] = dmflag | |
| qcflags[idx] = qcflag | |
| dsflags[idx] = dsflag | |
| end | |
| records << FinalRecord.new( | |
| year:year, values:values, dmflags:dmflags, qcflags:qcflags, dsflags:dsflags | |
| ) | |
| end | |
| Final.new(id:id, records:records) | |
| end | |
| attr_reader :id, :records | |
| def initialize(attrs) | |
| @id = attrs.fetch(:id) | |
| @records = attrs.fetch(:records) | |
| end | |
| def to_s | |
| "Final #{@id}: #{@records.length} records" | |
| end | |
| end | |
| def moving_average(a, n, precision) | |
| a.each_cons(n).map { |e| e.reduce(&:+).fdiv(n).round(precision) } | |
| end | |
| if $0 == __FILE__ | |
| db = {} | |
| final_filenames = get_final_filenames | |
| final_filenames.each do |final_filename| | |
| final = Final.from_file(final_filename) | |
| final.records.each do |f| | |
| next if f.year < 1900 | |
| f.values.each_with_index do |v, idx| | |
| if v | |
| month = idx + 1 | |
| db[f.year] ||= {} | |
| db[f.year][month] ||= [] | |
| db[f.year][month] << v | |
| end | |
| end | |
| end | |
| end | |
| avgs = [] | |
| db.each_pair do |year, months| | |
| months.each_pair do |month, values| | |
| avg = values.sum(0.0) / values.length | |
| avgs << ["#{year}-#{month}", avg / 100] | |
| end | |
| end | |
| avgs = avgs.sort {|a,b| a.first <=> b.first } | |
| temps = avgs.map(&:last) | |
| mavgs = moving_average(temps, 60, 2) | |
| r = avgs.map(&:first)[60..].zip(mavgs) | |
| r.each do |y| | |
| puts y.join(",") | |
| end | |
| end |
With this, generate some data to chart:
ruby calc-avg.rb > avg.csvNow, let’s make a new spreadsheet in Google Sheets. Import avg.csv. Highlight the data and insert a chart. Edit the chart and change the minimum and maximum values of the vertical axis to 10.56 and 12.5 respectively, to match the chart generated by NOAA. In the Series section, it’s possible to add a trend line.
Here’s what I see if I overlay the chart of the data generated by our program onto the chart generated by NOAA:
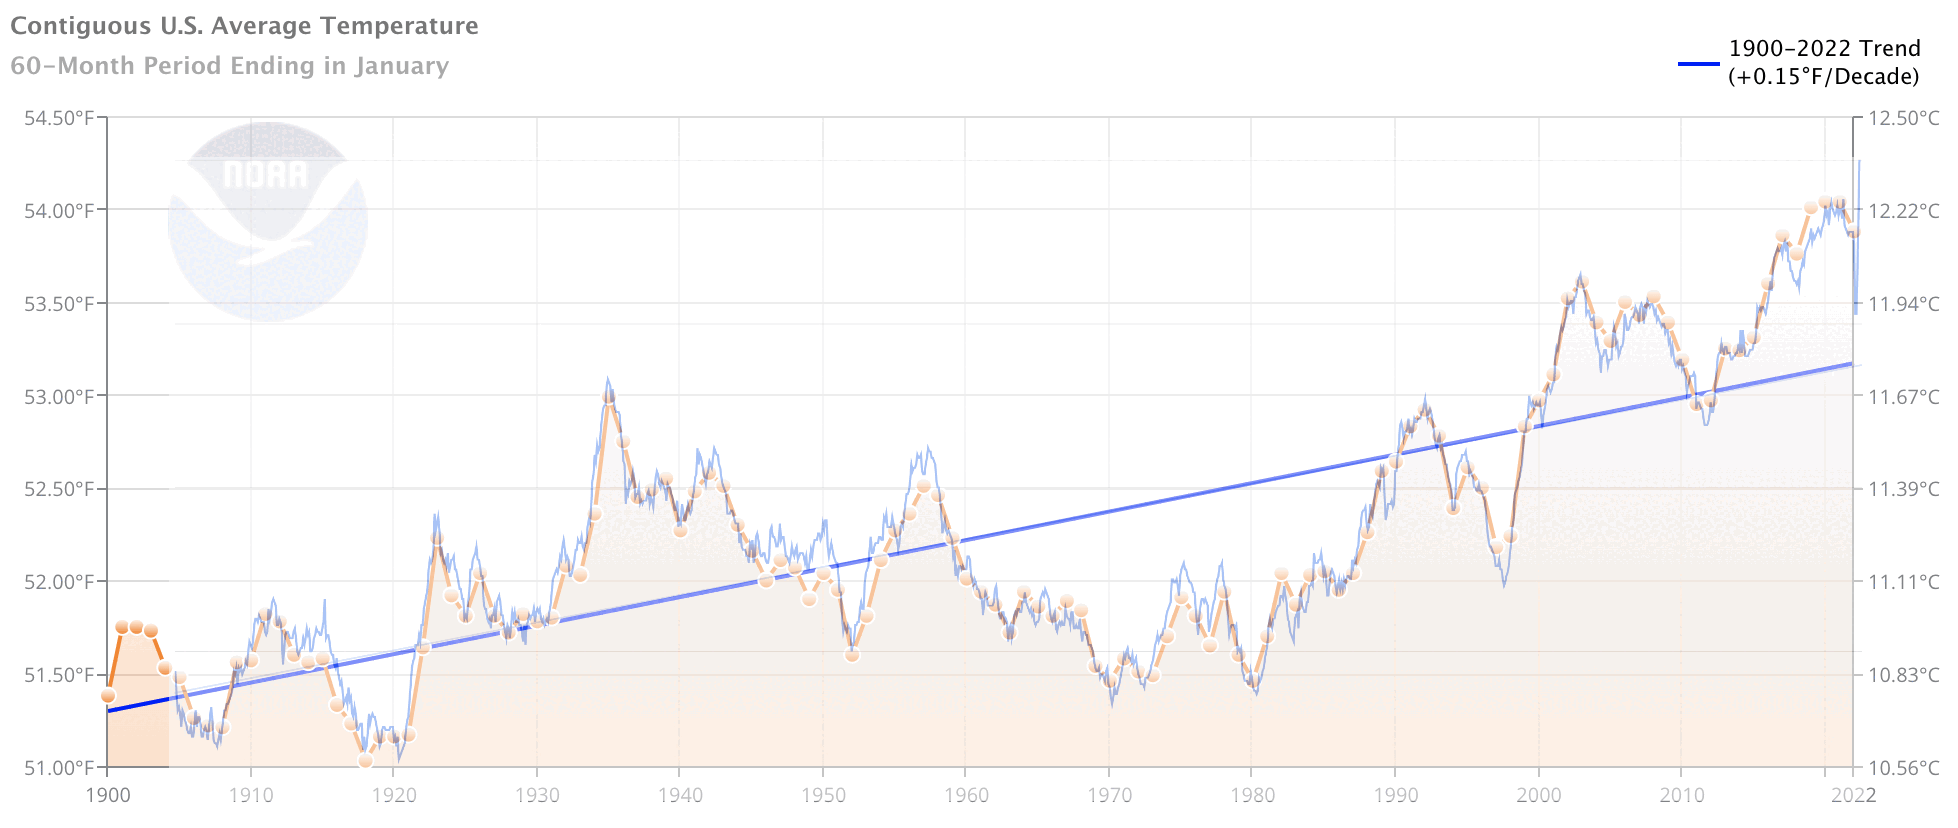
The program is probably not perfect, but it seems good enough to roughly reproduce NOAA’s chart. Can we conclude from this that NOAA is building their charts from the FLs.52j dataset, or some similarly processed dataset?
We actually downloaded more than one dataset. What happens if we set
DATASET = "raw"in the program and generate the data again using the *.raw.tavg files rather than the *.FLs.52j.tavg files? Let’s see.
ruby calc-avg.rb > avg2.csvHere are the two program outputs plotted together:
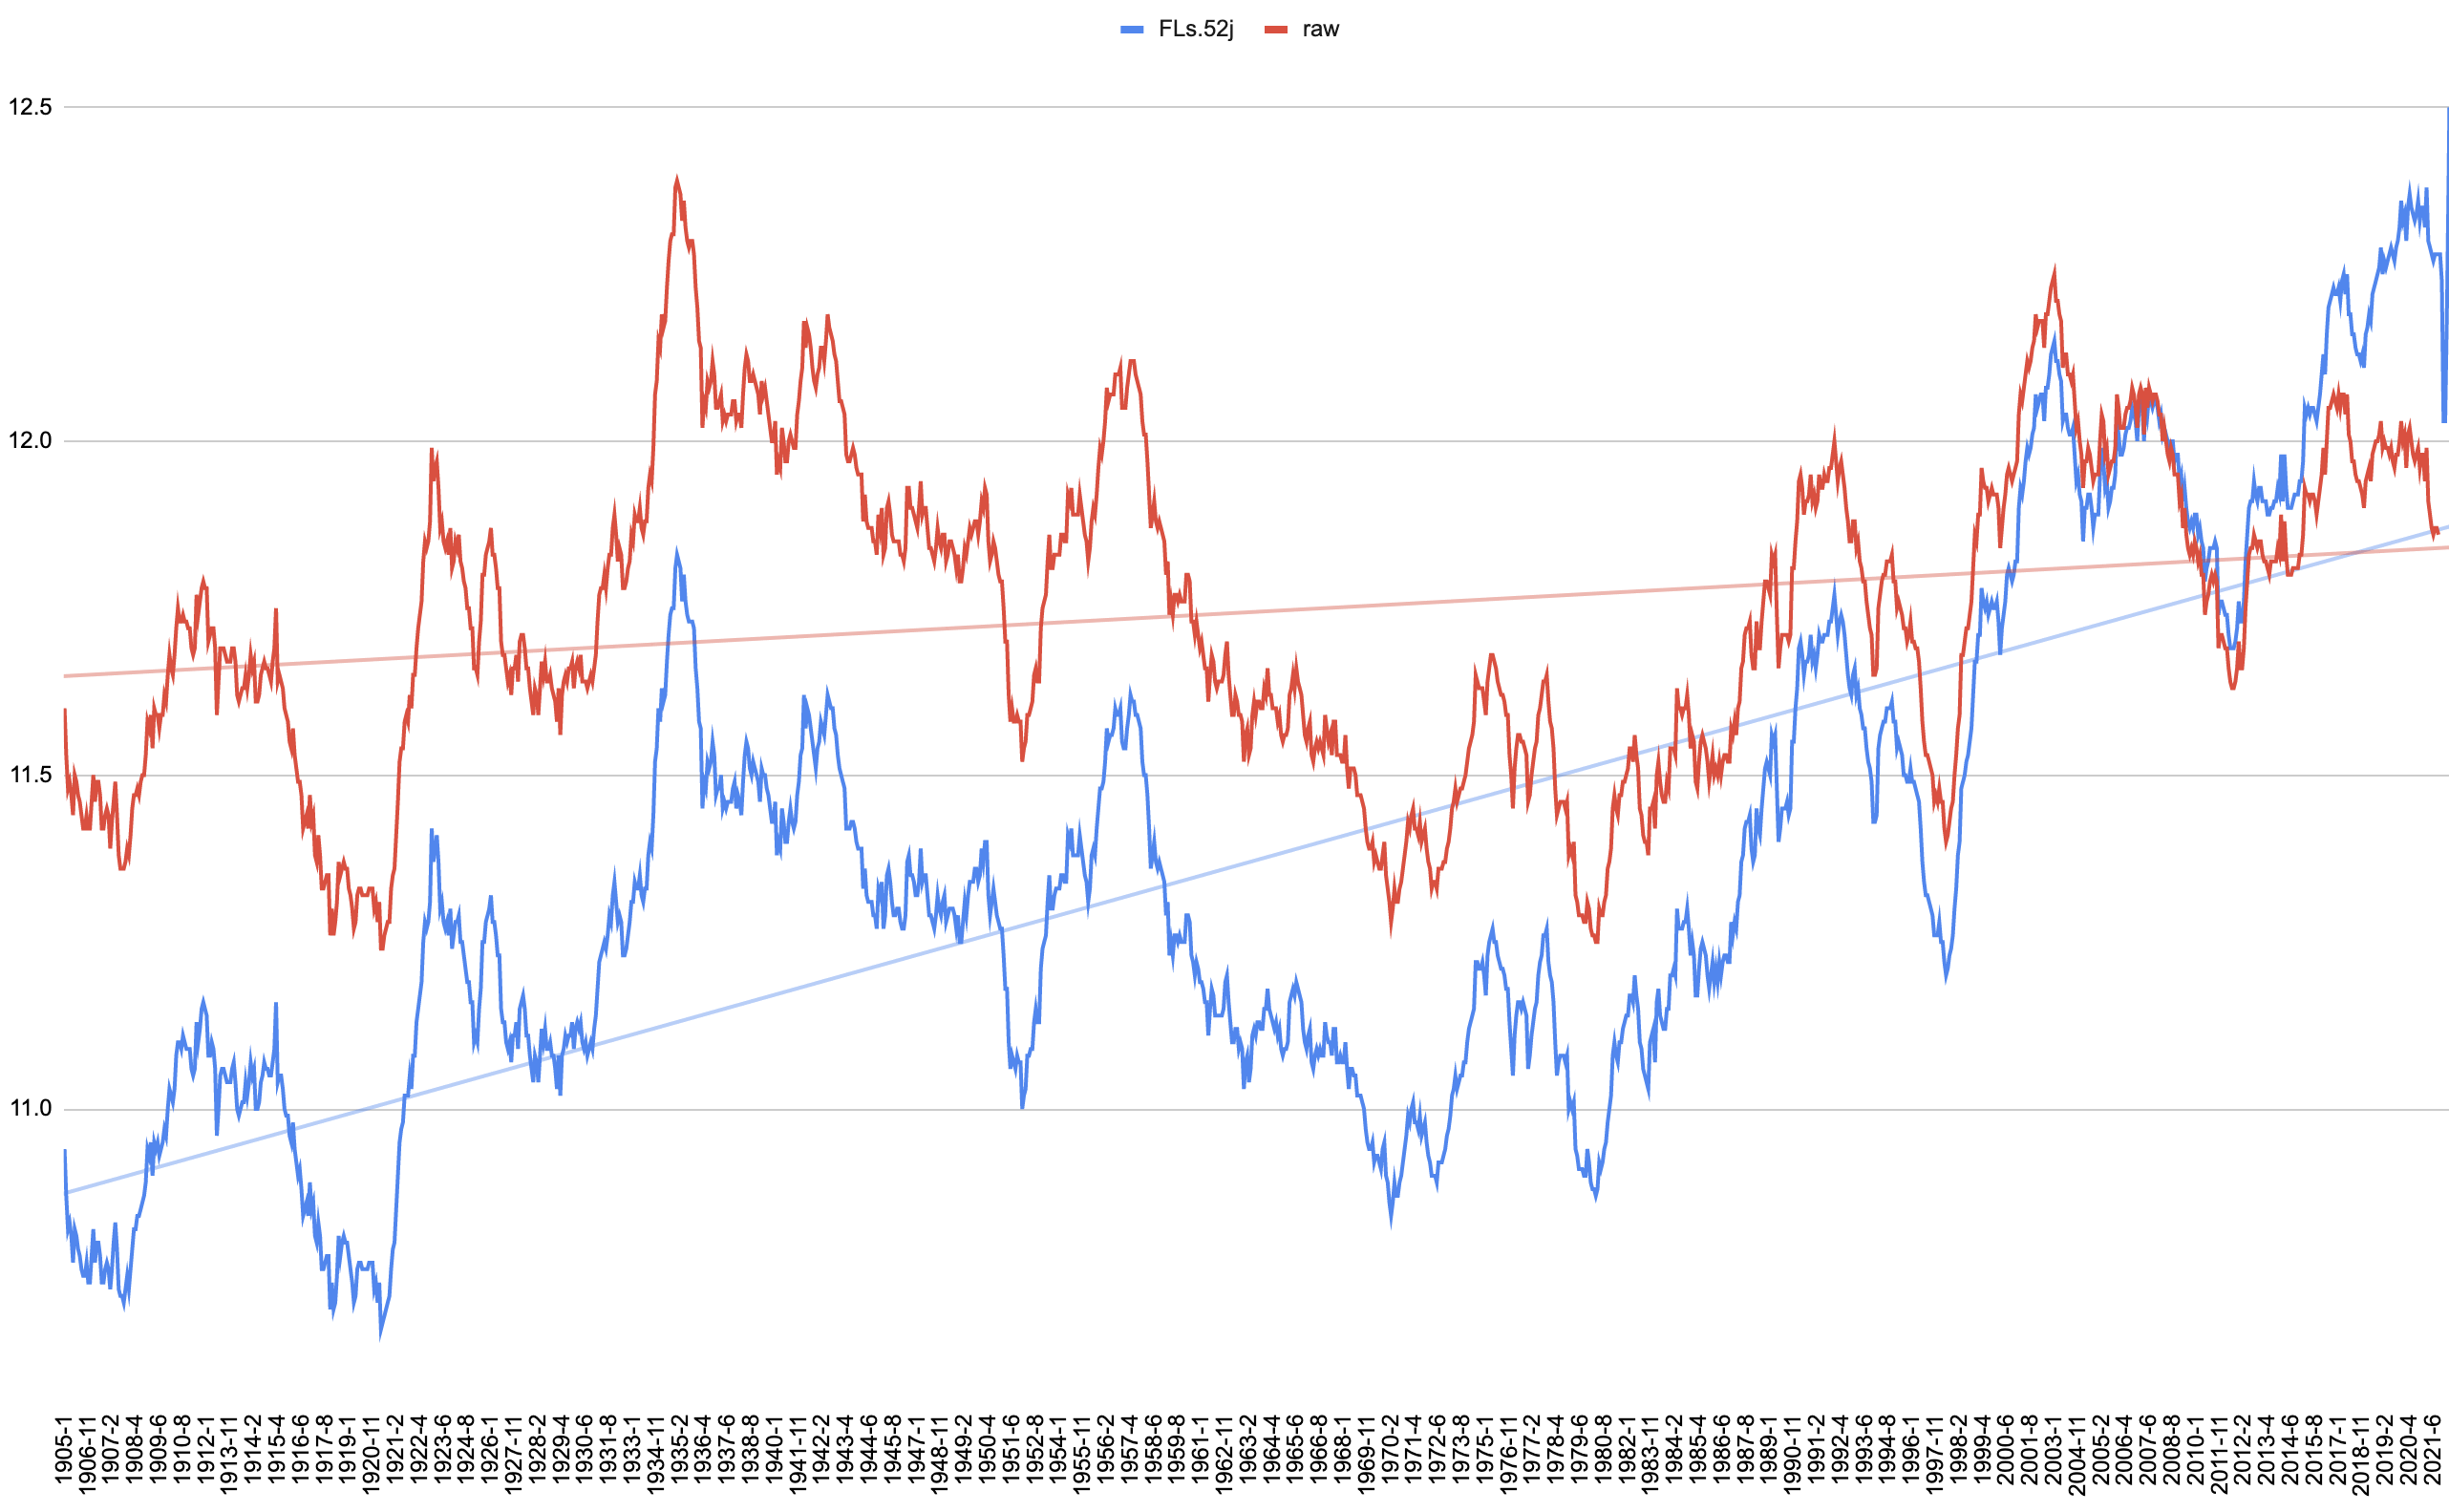
Wow. First, the raw trend line is much less steep. But besides that, NOAA’s finalizing process, whatever it is, seems to cool temperatures from the past and warm temperatures from the present by an amount that seems highly time-dependent. For example, compare the adjustments done in 1905, 1975, 1997, 2010, and 2020.
What would account for this? Thermometers were reading too hot in 1990 and needed to be cooled, but by 2015, thermometers were reading too cool and needed to be warmed? Why didn’t we standardize on the thermometers of 2005 or so, which apparently required no adjustments?
Oh—and in the raw data, the 1930s look like the hottest years on record, making the raw chart seemingly more consistent with innumerable historical records than the massaged final chart that NOAA seems to prefer.
Something is wrong here.